Articles/Works about my researchArticles and application programs about Software Engineering, Human-Computer Interaction, Computer Graphics, etc. |
| « Top |
3D Color Analysis
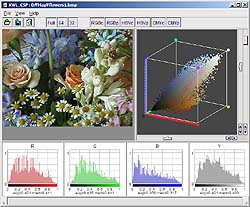
A visualization of the RGB color space provides interesting insight about the color distribution of the picture.
Objective
The purposes of this program is to grasp the pattern of the colors used in the image or to see the color variation which define the image.In order to do so, this program convert each pixel into 3D space according to its RGB value.

To achieve it, this program has such functions as follows:
-
Load *.jpg, *.png, *.bmp file.
-
Show total image in left screen.
-
Plot each pixel in right screen.
Those pixels are plotted in 3D space using various projections.
Screen snapshot of Color Spatioplotter
Program Download
iOS version is now available. The Method of projection of color in 3D space
There are various method to plot color value into 3D space.The projection methods are as follows:
RGB(x=R, y=G, z=B)

RGB (rotated)


a. Line (0,0,0)-(1,1,1) of Fig.1 is converted as Z-axis.
b. Emphasized to XY plane.
HSV,polar coordinate (x=S*cos(H), y=S*sin(H), z=V)

HSV(x=H, y=S, z=V)

CMY(K)(x=C, y=M, z=Y)
The value 'K' is not shown in the space.
CMYK (rotated)


a. Line (0,0,0)-(1,1,1) of Fig.5 is converted as Z-axis.
b. Emphasized to XY space.
c. Multiplying z value by 'K' value.
- Search
Recent Entries [-] - 3779